
TL;DR:
- There is a subtle difference between survey completion and response rate. Looking at the response rate in panels, you take into account the recruitment part as well.
- The disposition codes of the various stage and the eligible/non-eligible units are important in the calculation.
- With the completion rate, you only look at a specific survey and how many respondents were invited. The completion rate is always higher than the response rate.
Table of Contents:
Survey Completion Rate in panels
How to calculate completion rate in panel surveys
Importance of completion rate in panel surveys
Factors that affect completion rate in panel surveys
Survey Response Rate (in panels)
How to calculate the response rate
Importance of response rate in panel surveys
Factors that affect the response rate
Why total response rate calculation for a probability panel is somewhat complex
Differences between Completion Rate and Response Rate
Definition and calculation differences
Factors that affect each differently
Introduction
When visiting conferences, discussions with clients, or webinars we often see panel presentations using completion rate and response rates synonymously. At Lifepanel we are also getting asked what the response rate for our probability-based panel is (and it is not easy to answer that) but often clients are actually after the completion rate rather than the total response rate for a panel.
In this article, we will be looking at the differences between response rates and completion rates and we will add a small detour why the total response rate calculation for a probability panel is not that simple.
Panel surveys are a popular method of data collection used in market research, social science, and public opinion research. They involve surveying the same group of individuals over time to track changes in attitudes, behaviors, and experiences. There are two main types of panel surveys: access panels and probability-based panels. Access panels recruit participants through various means, such as online advertising or social media, while probability-based panels use random sampling methods to ensure a representative sample of the population. Both types of panels have their own advantages and limitations, and understanding these differences is crucial to effectively use panel surveys for research purposes.
Survey Completion Rate in panels
Definition of completion rate
The completion rate for panel surveys refers to the percentage of participants who fully complete a survey out of all those who were invited to participate. It is calculated by dividing the number of completed surveys by the total number of invitations sent out and multiplying by 100 to get a percentage. This metric is commonly used in market research to gauge the effectiveness of survey recruitment and to ensure that the sample size is representative and statistically significant. A high completion rate indicates that the survey was well-designed, relevant, and engaging for the participants, while a low completion rate may suggest issues with survey length, complexity, or incentives.
How to calculate completion rate in panel surveys
To calculate the completion rate in panel surveys, you can use the following formula:
Completion rate = (Number of completed surveys / Number of eligible respondents) x 100
In this formula, the number of completed surveys refers to the total number of surveys that were completed by respondents in the panel. The number of eligible respondents refers to the total number of respondents who were invited to participate in the survey.
By multiplying the result by 100, you can express the completion rate as a percentage.
Importance of completion rate in panel surveys
The completion rate is a crucial factor in panel surveys for market research. It refers to the percentage of participants who complete the survey from start to finish. A high completion rate ensures that the data collected is representative of the target population and reduces the risk of biased results. When conducting panel surveys, researchers rely on the participation of a specific group of individuals over time. If the completion rate is low, it can lead to a loss of valuable data and reduce the representativeness of the sample. Therefore, it is essential to monitor completion rates closely and take steps to increase participation when necessary. A high completion rate ensures that market researchers have access to reliable data, which is critical for making informed decisions and developing effective marketing strategies.
Factors that affect completion rate in panel surveys
There are several factors that can affect the completion rate of panel surveys in market research projects. One of the most important factors is the length and complexity of the survey. If the survey is too long or difficult to understand, respondents may abandon it before completing it. Another factor is the incentive offered to participants for completing the survey. If the incentive is not attractive enough, respondents may not feel motivated to complete the survey. The timing of the survey can also play a role, as respondents may be more likely to complete a survey during certain times of day or days of the week. Finally, the quality of the panel itself can affect completion rates, as a poorly recruited or unengaged panel may result in lower completion rates. One reason for that might be due to the fact that panel members get invited to too many surveys, with low rewards and lengthy, difficult questions.
Survey Response Rate (in panels)
Definition of response rate
According to the American Association for Public Opinion Research (AAPOR) guidelines, the response rate is defined as the number of complete interviews or surveys obtained divided by the number of eligible units in the sample. Eligible units refer to the individuals or entities that meet the criteria for inclusion in the sample. The response rate is an important measure of survey quality and can affect the validity and representativeness of the data collected. It is important to note that there are different ways to calculate response rates, and AAPOR guidelines provide a standardized approach to ensure consistency and comparability across studies.
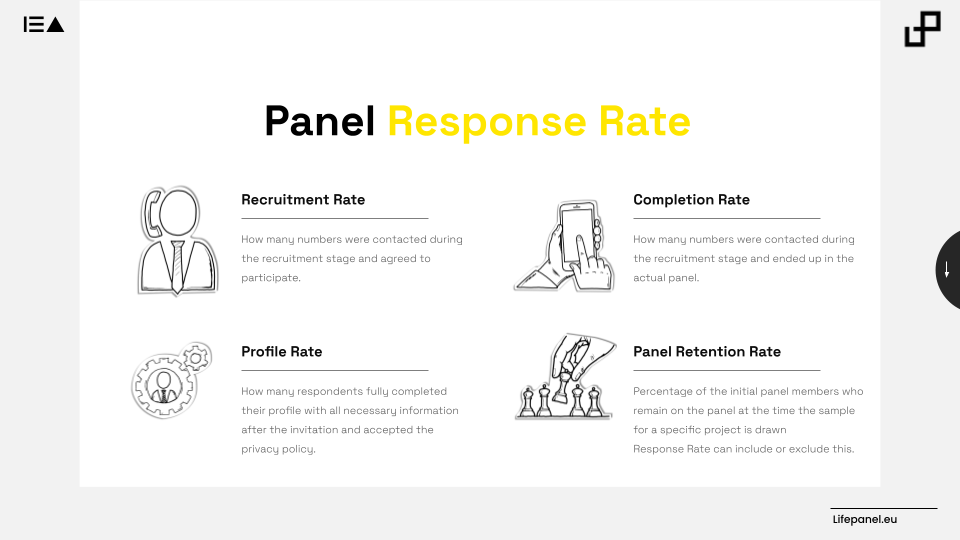
Figure 1: Panel Response Rate
How to calculate the response rate
Sure, calculating the response rate for telephone surveys using the AAPOR calculator involves a few steps. Here is an example of how to do it:
- First, gather your survey data. You’ll need to know the total number of phone numbers you dialed (N), the number of phone numbers that were non-working or disconnected (e.g., no longer in service) (e), the number of phone numbers where you reached an answering machine or voicemail (a), and the number of completed interviews (r).
- Next, calculate the Adjusted Response Rate (ARR) by using the following formula:
ARR = [(r / (N – e)) + a] / N
For example, if you dialed 1,000 phone numbers, had 100 non-working numbers, reached 200 answering machines/voicemails, and completed 300 interviews, your ARR would be:
ARR = [(300 / (1,000 – 100)) + 200] / 1,000ARR = 0.42 or 42%
- Finally, calculate the Cooperation Rate (CR) by using the following formula:
CR = r / (r + a)
Continuing with the above example, your CR would be:
CR = 300 / (300 + 200)CR = 0.6 or 60%
To make these calculations easier, you can use the AAPOR calculator which can be found on their website. Simply input your data and it will calculate both the ARR and CR for you.
Have in mind that when using a screened RDD sample, you should also take into account the total generated sample and the screened-out sample. The response rate calculations always require the disposition from the fieldwork as well as the disposition codes from the pre-screening of the sample.
Importance of response rate in panel surveys
Response rate is a crucial factor in panel surveys as it directly affects the quality and reliability of the data collected. A high response rate ensures that the sample accurately represents the population being studied, which in turn increases the generalizability of the findings. Moreover, a low response rate may introduce bias into the data, leading to inaccurate conclusions and unreliable results. Therefore, it is important to take measures to increase response rates, such as offering incentives, using multiple modes of contact, and maintaining good communication with participants. By prioritizing response rates in panel surveys, researchers can ensure the validity and usefulness of their findings.
Response rate is one of the contributors to response bias. If the characteristics of the non-response population are different from the respondents, then it will introduce a bias. If the respondent and non-respondent are random, the resulting response bias will be limited.
Factors that affect the response rate
Panel surveys are an essential tool for researchers to collect data from a group of individuals over time. However, the response rate in panel surveys can be affected by various factors. One of the main factors is the length and complexity of the survey questionnaire. Respondents might lose interest or get tired of answering questions if the survey is too long or complicated. Another factor is the timing and frequency of the survey. If the surveys are conducted too frequently or at inconvenient times, respondents might not have enough time to respond, or they might lose interest in participating. Additionally, the incentives offered to respondents can also affect the response rate. Providing appropriate incentives can encourage respondents to participate and increase the response rate. Finally, the quality of communication between researchers and respondents is also essential. Clear instructions, reminders, and follow-ups can help maintain engagement and increase the response rate in panel surveys.
Looking a the recruitment part of panels, this also impacts the response rate. Depending on the mode such as ABS or RDD CATI sampling, the response rate might be different.
Why total response rate calculation for a probability panel is somewhat complex
Calculating the response rate for a probability panel survey can be challenging due to several factors. Here is an outline explaining why it is difficult:
- Panel Attrition: Over time, panel members may drop out or become inactive, leading to a decrease in the overall response rate. Tracking and accounting for panel attrition can be complex and time-consuming.
- Panel replenishment: Similar to panel attrition, panel members need to be replenished as a probability panel is usually not a longitudinal panel without replenishment.
- Looking at the disposition codes: They change over time when looking at a panel that is built based on an RDD sample frame. Some of the working numbers can become invalid and vice versa. All the calculations are based on a specific moment in time when part of the panel was recruited or a survey was completed.
These are some of the factors why the overall responsibility for a probability-panel are difficult to establish.
Differences between Completion Rate and Response Rate
Definition and calculation differences
Completion rate and response rate are two important metrics used in panel surveys within market research.
Response rate refers to the percentage of people who respond to the survey out of the total number of people who were invited to participate – this also includes the panel members that have been invited to join the panel but did not participate in the panel.
Completion rate, on the other hand, refers to the percentage of people who complete the entire survey after having been invited for that specific survey.
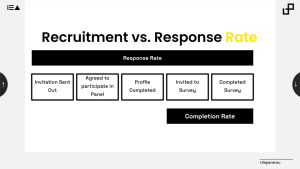
Figure 2: Recruitment vs. Response Rate
In other words, the response rate measures the initial willingness of people to participate in a panel and survey, while the completion rate measures their actual engagement with the survey once they are a member of a panel. Both metrics are important for evaluating the quality and representativeness of panel surveys within market research. Overall panel response rate can be increased by specific
Important differences
Factors that affect each differently
- Survey completion rate can be affected by factors such as survey length, question complexity, and respondent fatigue, while response rate in panels can as well be affected by factors such as incentive amount, survey topic relevance, and the demographics of panel members.
- Response rate is also impacted by the recruitment stage during panel-building. Eg. are incentives offered, which method is used for recruitment, what is asked in the recruitment survey, and so on.
- A low recruitment rate (which impacts the overall response rate) can still lead to a high completion rate of surveys as long as the questionnaires are well-designed, incentives are in place, survey frequency is not too high and the panel is well-engaged.
- The survey completion rate is a measure of engagement and interest in the survey among those who were invited, while the response rate in panels is a measure of the representativeness of the invited respondents for a panel and the willingness of respondents to participate in surveys.
- The survey completion rate is typically higher than the response rate in panels because some respondents may drop out of the survey before completing it, while some panel members may not respond to the invitation at all. A large drop-off also occurs during the recruitment stage for panel building.
Conclusion
When looking at surveys derived from panels, usually completion rate is measured to compare the engagement of a panel in a survey. When looking at the total response rate, one might get a better picture of the representativeness even though a low response rate might not directly lead to a response bias. When looking at a probability panel, the total response might also be an indicator to showcase the efforts required for the recruitment of a panel.
Within Lifepanel we keep track of all the samples drawn, the full disposition codes for each number contacted as well as the interactions with every panel member. By doing so we are able to provide clients with a transparent outline of the recruitment but also the panel engagement part.
Looking at the completion rate, it is important to report on the demographics of the completed surveys, the invited but not completed surveys as well as the panel demographics. This helps to evaluate which survey can be considered “representative”.